


Unseen Opportunities Timeless Portfolio
Portfolio Rationale:-
This Model Portfolio is designed for investors aiming to build long-term wealth through a disciplined, diversified approach while managing high market volatility.
It follows a high to very high risk strategy and is suitable only for aggressive investors who are comfortable with extreme fluctuations in returns.
In this portfolio, we identify high-quality investment opportunities across the Small Cap and Micro Cap universe, along with selective exposure to Index ETFs to ensure broad market participation and disciplined risk management.
Market capitalization typically ranges from ₹100 crore to ₹10,000 crore, depending on opportunity strength.
At times, select mid-cap stocks may also be included to enhance portfolio stability and balance risk.
Focused on Small & Micro Caps with selective ETFs and occasional mid-caps for stability and diversification.
⏳ Holding Time: Minimum 3 Years & More
⚠️ RISK WARNING / DISCLAIMER
This model portfolio is NOT suitable for low-risk investors.
It involves very high risk and during extreme market conditions:
• Your portfolio may face 50%+ drawdowns
• In worst-case scenarios, up to 100% capital loss is possible
This strategy is meant only for those who:
✅ Understand market volatility
✅ Can handle deep fluctuations emotionally & financially
✅ Invest with proper risk management
📉 Market crashes can severely impact portfolio value.
Please invest only after understanding all risks involved.
Rebalance Review Frequency:- Quarterly || Portfolio Allocation: % Wise Allocation ||
⚠️ Small & Micro Cap Investment Risk Rationale:
Small-cap and micro-cap companies generally carry very high risk due to low liquidity, limited business stability, and sharp price fluctuations.
These stocks can experience:
• Sudden price drops of 40% or more after entry
• Sharp rallies followed by equally steep corrections (40–50%)
• High volatility caused by low trading volumes
• Greater vulnerability to business failure or bankruptcy
Due to these factors, investments in small and micro-cap stocks may result in significant capital loss and are suitable only for investors with very high risk tolerance and a long-term investment horizon.
Portfolio Managed By:
PANKAJ KUMAR JAIN (Proprietor) EYE ON TRADE RESEARCH || SEBI Registration No.: INH000021386 || BSE Enlistment No.: 6592 ||
Investment Horizon:-
For each portfolio, the manager provides a recommended investment time duration to realise the best returns for the portfolio. Each portfolio has one of the following recommended investment horizon:
Short Term: For portfolios with recommended investment duration of <1 year
Medium Term: For portfolios with recommended investment duration of 1-3 years
Long Term: For portfolios with recommended investment duration of >3 years
Asset Class:
The specific constituents of each Stock/ETF portfolio are selected from a universe
defined by the managers. This constituent universe is labelled as Asset Class.
If the asset class is Equity Large Cap, then all underlying portfolio constituents are
selected from the Large Cap segment representing top 100 companies by market
capitalisation listed on the NSE (National Stock Exchange of India)
If the asset class is Equity Mid Cap, then all underlying portfolio constituents are
selected from the Mid Cap segment representing the companies ranked 101 to 250 by
market capitalisation listed on the NSE (National Stock Exchange of India)
If the asset class is Equity Large & Mid Cap, then all underlying portfolio constituents
are selected from the Large & Mid Cap segment representing the top 250 companies
by market capitalisation listed on the NSE (National Stock Exchange of India)
If the asset class is Equity Small Cap, then all underlying portfolio constituents are
selected from the Small Cap segment representing the companies ranked greater
than 251 by market capitalisation listed on the NSE (National Stock Exchange of India)
If the asset class is Equity Mid & Small Cap, then all underlying portfolio constituents
are selected from the Mid & Small Cap segment representing the companies ranked
greater than 100 by market capitalisation listed on the NSE (National Stock Exchange
of India)If the asset class is Equity Multi Cap, then all the underlying portfolio constituents are
selected from Multi Cap segment which may include companies from more than two
of the Large Cap, Mid Cap, Small Cap categories as described above
If the asset class is Debt, then all the underlying portfolio constituents are Debt
instruments
If the asset class is Commodity, then all the underlying portfolio constituents are
Commodity instruments
If the asset class is Commodity and Debt, then all the underlying portfolio
constituents are either Debt or Commodity instruments
If the asset class is Multi-Asset, then the underlying portfolio constituents comprise a
mix of Equity, Gold, Silver, Commodity, Debt or REIT/INVIT constituents.
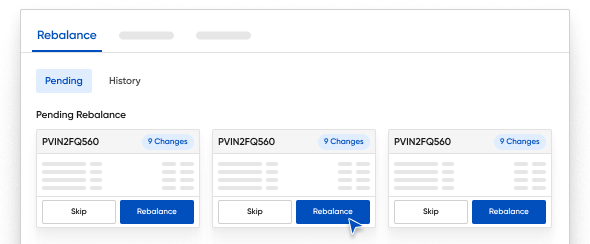
Rebalance:-
Rebalancing is the process of periodically reviewing and updating the constituents of a portfolio. This is done to ensure that constituents in the portfolio continue to reflect the underlying theme or strategy.
Categorisation of portfolio constituents:
All portfolio constituents fall in one of the below categories:
📊 Portfolio Classification
All portfolio constituents fall under the following categories:
• Small Cap Stocks
• Micro Cap Stocks
• ETFs (Exchange Traded Funds)
📈 Market Capitalization Range:
₹100 Crore to ₹10,000 Crore
This portfolio focuses on high-growth potential segments and may experience high volatility.
📊 Market Capitalization Classification (NSE & BSE)
All stocks listed on the NSE (National Stock Exchange) and BSE (Bombay Stock Exchange) are arranged in descending order of market capitalization, where the company with the highest market cap is ranked first.
Based on this ranking:
• Large Cap Stocks – Rank 1 to 100
• Mid Cap Stocks – Rank 101 to 250
• Small Cap Stocks – Rank Above 250
Methodology (Trading & Analysis Approach)
📌 Methodology
Our research and trading decisions are entirely based on Technical Analysis and Price Action.
We primarily focus on:
• Market trend and structure analysis
• Key support and resistance levels
• Breakout and consolidation patterns
• Multi-timeframe chart confirmation
• Strict risk management with predefined stop-loss
Our approach prioritizes capital protection first and consistent performance second.
We do not promise guaranteed returns, as all trading involves risk.
📌 Core Technical Trading Tool
Our primary technical approach follows a “Buy at Low – Sell at High” framework, supported by our proprietary Dot Level Strategy.
This is a personally developed and confidential trading methodology where:
• Price charts are analyzed in depth
• Key demand (support) and supply (resistance) zones are identified
• High-probability dot levels are marked for precise entry and exit planning
• Trades are executed only when price reaches these strategic levels
This tool allows us to capture market moves with controlled risk and defined structure, rather than random entries.
📌 Methodology (Additional Fundamental Filters)
Along with Technical Analysis and Price Action, we incorporate basic fundamental screening to enhance the quality of stock selection and improve risk-reward outcomes.
Our portfolio construction focuses on identifying stocks where both technical strength and fundamental quality align.
As a result of this approach, the portfolio’s market capitalization exposure generally ranges between ₹100 crore and ₹10,000 crore, depending on prevailing market opportunities and conditions.
📊 Key Stock Selection Criteria
Stocks are selected based on multiple quality-focused parameters, including:
• Strong promoter holding and demonstrated commitment
• Visible smart money / institutional participation (where available)
• Positive and improving cash flow trends
• Lower free-float equity to support stronger price momentum
• Consistent earnings (EPS) growth
• Reasonable valuation levels when opportunities arise
• Long-term business growth potential
These are applied alongside technical and risk-management filters to balance volatility while targeting high-growth opportunities.
Product Strategy:-Maximum 25 -30 Stock portfolio & 2-3 Etfs
We generally follow an equal-weight allocation strategy across selected stocks to maintain balanced risk exposure.
However, based on market conditions, volatility, and risk assessment, weights may be slightly increased or decreased from time to time to optimize portfolio performance while controlling downside risk.
📈 ETF Allocation Strategy
The portfolio also includes ETFs across different market segments, such as:
• Broad market indices
• Small-cap and mid-cap focused ETFs
• Sectoral and thematic ETFs
This approach helps in diversification, risk balancing, and capturing growth from multiple areas of the market.
Risk Disclosure:
Please note that investing in securities involves various types of risks that may impact
investments. Key risks that can affect all asset classes inter alia include changes in:
Market volatility
General market conditions
Trading volumes/liquidity and settlement periods
Interest rates
Rate of inflation
Domestic and/or global political, economic and financial developments
Policies and/or legal and regulatory frameworks by government and other appropriate authorities.
Asset class-specific risks inter alia include:
a. Risks related to Equity and Equity Linked Investments (ELIs) include:
Equity shares and equity related instruments are volatile and prone to price fluctuations on a daily basis. The price of securities may be affected by factors, such as price and trading volume volatility, currency exchange rates, company specific news and rumours, etc. Midcap and smallcap stocks generally exhibit higher volatility compared to largecap stocks.
b. Risk related to investment in Debts, Bonds and Money Market Instruments
Interest Rate Risk: Changes in interest rates may affect valuation of securities, as the prices of securities generally increase as interest rates decline and generally decrease as interest rates rise. Prices of long-term securities generally fluctuate more in response to interest rate changes than prices of short-term securities.
Credit Risk: Credit risk refers to the risk that an issuer of a fixed income security may default or be unable to make timely principal and interest payments on the security. Normally, the value of a fixed income security will fluctuate depending upon the changes in the perceived level of credit risk as well as any actual event of default.
Liquidity Risk: The liquidity of a bond may change, depending on market conditions leading to changes in the liquidity premium attached to the price of the bond. At the time of selling the security, the security can become illiquid.
c. Risk related to exposure to Equities, Debt and Commodity through Exchange Traded
Funds (ETFs)
Sector/Index Risk: ETFs that track specific sectors or indices are exposed to concentration risks. Adverse performance in those sectors or indexes can significantly impact returns.
Tracking Errors: While ETFs aim to mirror their benchmark, they may not perfectly
track the concerned benchmark, leading to performance deviations due to factors like expenses or liquidity constraints of the underlying constituents of the ETF. Liquidity Risk: In volatile markets, liquidity for certain ETFs may be low, making it harder to buy or sell units without affecting the price significantly.
d. Risk related to Commodity related Instruments
Risk related to commodity (including gold and silver) related instruments are affected by several factors. The price of a commodity may be affected by factors including its demand-supply dynamics in domestic and global markets, restrictions on the movement/trade of the commodity in domestic and global markets, Indian and foreign exchange rates, large scale transactions in the commodity by
governments, central banks and other major institutions, etc.
e. Risk related to investments in Real Estate Investment Trusts (REITs) and Infrastructure
Investment Trusts (InvITs)
Sector Risk: Changes in the real estate and infrastructure sector including changes in applicable laws and regulations can affect the price and volatility of securities/instruments of REITs and InvITs.
Interest Rate Risk: REITs/InvITs usually secure loans at the trust level andsubsequently distribute the amount among the underlying special purpose vehicles (SPVs). In case of a rising interest rate environment, debt payment increases for the trust and adversely impacts the cash flow for unitholders. This inturn reduces cash flow-based valuations of REITs/InvITs.
Credit Risk: Credit risk refers to the risk that an issuer of a REIT/InvIT
security/instrument may default on interest payment or even on paying back the principal amount on maturity. Further, valuations may be affected by change in the credit rating assigned to the REIT/InvIT and their SPVs by credit rating agencies.
Asset Transfer/Acquisition Risk: The valuation of REITs/InvITs heavily depend on the
underlying assets held by the trust. There is a risk that the transfer or acquisition of
these assets, which often relies on sponsors/management commitments, may not
materialise as planned. If the assets are not transferred or acquired, the valuation
of the trust and future cash flows may be significantly impacted.
Risk of lower than expected Distributions: The distribution by a REIT/InvIT will be
based on the net cash flows available for distribution. The amount of cash available
for distribution principally depends upon the amount of cash that the REIT/InvIT
receives as dividends or the interest and principal payments from portfolio assets.
In the light of the risks involved, you should transact in securities only after
understanding the associated risks. Please consider and assess all risk factors and your
risk tolerance before making investment decisions.
PANKAJ KUMAR JAIN(Proprietor) EYE ON TRADE RESEARCH is registered with SEBI with INH000021386 as the SEBI registration number. The registered office address of 336 2nd Floor Left Side Gali No 4, Govindpuri Kalkaji, DELHI, NATIONAL CAPITAL TERRITORY OF DELHI, 110019Contact Person PANKAJ JAIN The manager is a member of BSE Limited with Membership Number 6592. The content and data available in the material prepared by the company and on the website of the company, including but not limited to index value, return numbers and rationale are for information and illustration purposes only. Charts and performance numbers do not include the impact of transaction fee and other related costs. Past performance does not guarantee future returns and performances of the portfolios are subject to market risk. Data used for calculation of historical returns and other information is provided by exchange approved third party vendors and has neither been audited nor validated by the Company.
Information present in the material prepared by the company and on the website of the company shall not be considered as a recommendation or solicitation of an investment. Investors are responsible for their investment decisions and are responsible to validate all the information used to make the investment decision. Investor should understand that his/her investment decision is based on personal investment needs and risk tolerance, and information present in the material prepared by the company and on the website of the company is one among many other things that should be considered while making an investment decision.
Investments in securities market are subject to market risks. Read all the related documents carefully before investing. Registration granted by SEBI, membership of BSE and certification from NISM in no way guarantee performance of the intermediary or provide any assurance of returns to investors.
In line with SEBI regulations, we have enabled UPI handles for payments relating to research services to EYE ON TRADE RESEARCH:- pankajkumar.cf.ra@validaxis
The Company has neither been suspended nor debarred from doing business by any Stock Exchange / SEBI or any other authorities; nor has its certificate of registration been cancelled by SEBI at any point of time. The Company is not engaged in merchant banking, investment banking or any brokerage services. Unless otherwise stated, the percentage returns displayed on the website or any other marketing materials are Absolute Returns.
Reports or research material prepared by the company are not to be construed as an offer to buy /sell or the solicitation of an offer to buy / sell any security in any jurisdiction where such offer or solicitation would be illegal. Reports or research material prepared by the company do not constitute a personal recommendation or take into account the particular investment objectives, financial situations, risk profile and needs of individual clients.
While we endeavour to update the information / material on various products and reports created by us, on a reasonable basis, there may be regulatory, compliance or other reasons that prevent us from doing so.
The Company does not provide any promise or assurance of favourable view for a particular industry or sector or business group in any manner. The investor is requested to take into consideration all the risk factors including their financial condition, suitability to risk return profile and take professional advice before investing.
The analysts for various products or reports created by the company certify that all of the information /material therein accurately reflect his or her personal views about the subject company or companies and its or their securities, and no part of his or her compensation was, is or will be, directly or indirectly related to company(ies) in various products or reports created by the company. No part of this material may be duplicated in any form and/or redistributed without the prior written consent of the Company.
Research Analyst Disclosures:
Statements on ownership and material conflicts of interest, compensation - ARSSBL and Associates
The Research Analyst or its associate or relative has any financial interest in the subject company and the nature of such financial interest. No
The Research Analyst / its Associates / its Relatives have actual/beneficial ownership of one per cent or more securities of the subject company, at the end of the month immediately preceding the date of publication of this research report. No
The Research Analyst / its Associates / its Relatives have any other material conflict of interest at the time of publication of this research report. No
The Research Analyst / its Associates / its Relatives have received any compensation from the subject company in the past twelve months. No
The Research Analyst / its Associates / its Relatives have managed or co-managed public offering of securities for the subject company in the past twelve months. No
The Research Analyst / its Associates / its Relatives have received any compensation for investment banking or merchant banking or brokerage services from the subject company in the past twelve months. No
The Research Analyst / its Associates / its Relatives have received any compensation for products or services other than investment banking or merchant banking or brokerage services from the subject company in the past twelve months. No
The Research Analyst / its Associates / its Relatives have received any compensation or other benefits from the subject company or third party in connection with this research report. No
The Research Analyst / its Associates / its Relatives have served as an officer, director or employee of the subject company. No
The Research Analyst / its Associates / its Relatives have been engaged in market-making activity for the subject company.
📢 For risk disclosures, disclaimers, MITC, investor charter, grievances, and more, please visit: www.eyeontrade.com
Compliance Officer: Pankaj Kumar Jain
📧 Email:[email protected]
📞 Phone: +91 8986506414
📣 Regulatory Escalation (if unresolved within 7 days):
If you're dissatisfied with our response, raise complaints through:
🌐 SEBI SCORES: https://scores.sebi.gov.in/
🌐 SEBI ODR Portal: https://smartodr.in/
📞 Toll-Free SEBI Helpline: 1800 22 7575 / 1800 266 7575
📚 Investor Education & Downloads:
🔗 SEBI Investor Awareness Portal: https://investor.sebi.gov.in/
📱 Saarthi App (Android): Google Play Store
📱 Saarthi App (iOS): Apple App Store
📌 View our Investor Charter, Complaint Table, Disclosures, & Risk Policies: www.EYEONTRADE.com
We strictly urge you to read all risk disclosures carefully before making any investment or trading decision.
Understanding the associated risks is essential to protect your capital and make informed choices.
Standard warning
“Investment in securities market are subject to market risks. Read all the related documents carefully before investing.“
Disclaimers
“Registration granted by SEBI, enlistment with RAASB and certification from NISM in no way guarantee performance of the Research Analyst or provide any assurance of returns to investors.”